From a Mobile Score of 49 to 98
How we optimized the Imuno Cubano WordPress and Bricks website
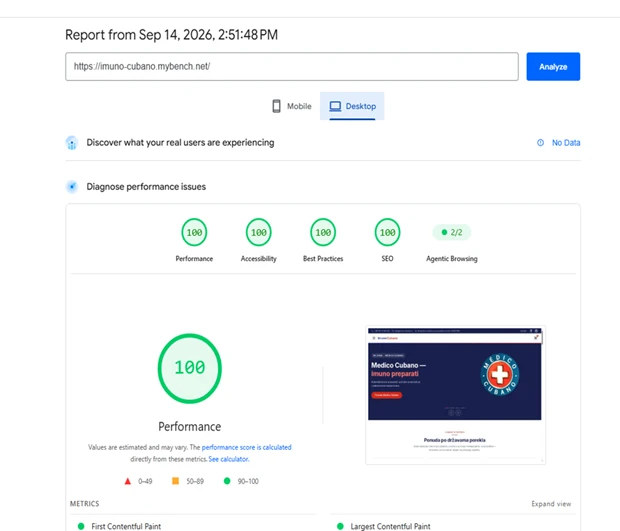
| Outcome Desktop Performance increased from 61 to 100, mobile Performance from 49 to 98, while Accessibility, Best Practices and SEO reached 100. |
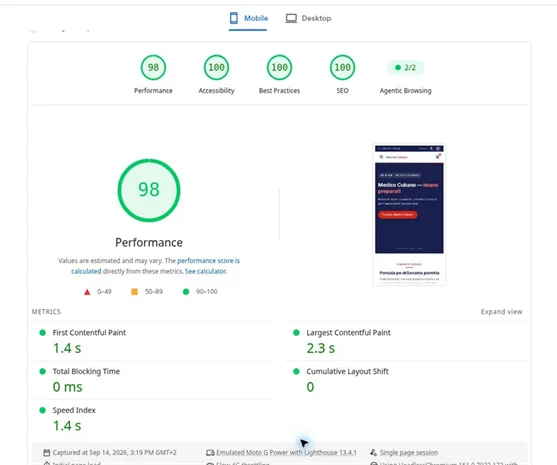
Final mobile Lighthouse result: Performance 98, Accessibility 100, Best Practices 100 and SEO 100.
Executive summary
WordPress speed optimization rarely comes down to one switch. Instead, the largest gains on Imuno Cubano came from separating real bottlenecks from warnings that looked important but had little effect on the score. The project began with a mobile Performance score of 49 and a desktop score of 61. The final follow-up measurements reached 98 on mobile and 100 on desktop.
The work focused on the rendering path above the fold: image discovery, local font delivery, slider visibility, CSS loading and JavaScript timing. We measured every major change independently. As a result, we rejected several aggressive optimizations because they delayed the hero content or produced unstable CSS application.
| Metric | Desktop before | Desktop after | Mobile before | Mobile after |
| Performance | 61 | 100 | 49 | 98 |
| Accessibility | 95 | 100 | 95 | 100 |
| Best Practices | 96 | 100 | 100 | 100 |
| SEO | 100 | 100 | 100 | 100 |
| FCP | 0.8 s | 0.4 s | 1.7 s | 1.4 s |
| LCP | 3.4 s | 0.9 s | 12.5 s | 2.3 s |
| TBT | 0 ms | 0 ms | 0 ms | 0 ms |
| CLS | 0.454 | 0 | 0.976 | 0 |
1. Baseline: a fast server, but unstable rendering
We recorded the first Lighthouse measurement on August 25, 2026. Total Blocking Time was already 0 ms on both device profiles, which was a crucial diagnostic signal. Therefore, long main-thread tasks did not cause the severe mobile LCP and CLS values. They pointed instead to late hero rendering, resource priority and layout instability.
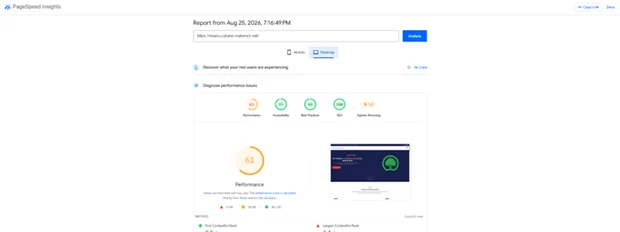
Figure 1. Desktop baseline: Performance 61 before optimization.
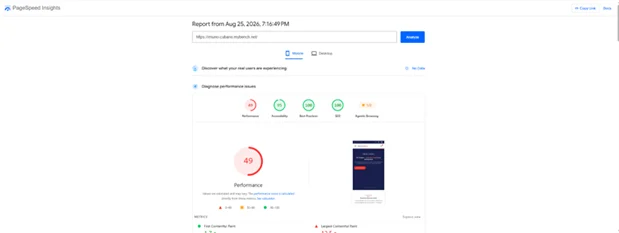
Figure 2. Mobile baseline: Performance 49 before optimization.
2. Accessibility was resolved first
The initial Accessibility score of 95 came from low color contrast, a weak keyboard focus treatment and a skipped heading level. Brand red remained available for decorative use, while we introduced darker accessible red and green values for text, buttons and status labels. We also changed the heading labelled “DRŽAVE” from H4 to the correct semantic level without altering its visual design.
- Accessible red for text and controls: #C4141B; darker hover state: #9F1016.
- Stock-status green changed to #137A44.
- Keyboard focus received a clearly visible 3 px outline.
- Heading hierarchy was corrected in Bricks.
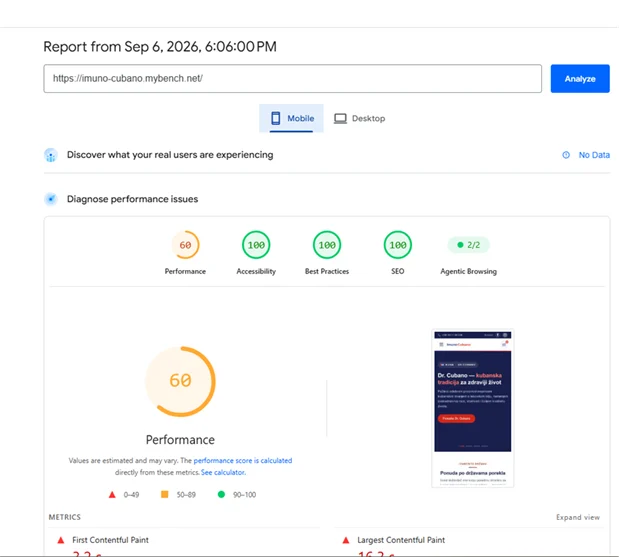
Figure 3. Accessibility reached 100 after contrast and semantic heading corrections.
3. Removing unnecessary render-blocking resources
The original critical path contained separate icon libraries, WooCommerce styles, Bricks frontend styles, the child-theme stylesheet and Google Fonts CSS. First, we replaced the search and cart icons with inline SVG. Then we removed Google Fonts and served Inter locally. As a result, we reduced network dependencies without disabling functionality that product, category and cart pages still required.
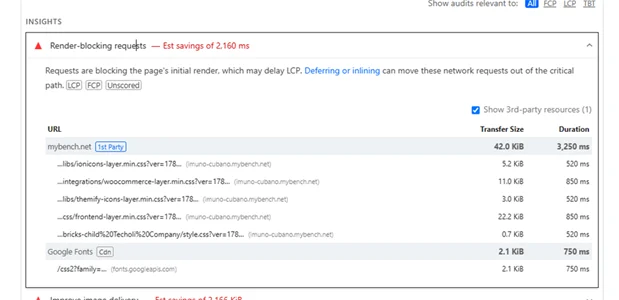
Figure 4. The initial render-blocking audit exposed several independent CSS requests.
| Key principle A resource that is unnecessary on the home page should be removed conditionally, not disabled globally when product and checkout pages still depend on it. |
4. Hero image delivery
The original desktop hero image was 1261 × 1195 pixels and approximately 92.8 KiB, although it was rendered at roughly 300 × 284 pixels. Therefore, we resized the source to 600 × 569 pixels. Because the image is above the fold, it was explicitly loaded with loading=”eager” and fetchpriority=”high” instead of lazy loading.
After this change, the “Improve image delivery” warning disappeared. Desktop LCP resource load delay fell from approximately 1,640 ms to about 110 ms, while the resource itself loaded in roughly 60 ms.
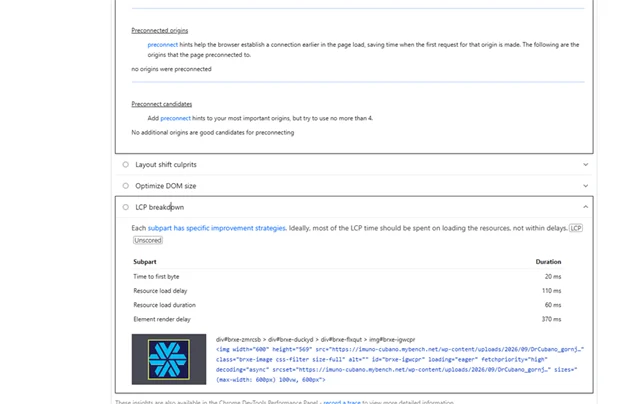
Figure 5. Image diagnostics after resizing the hero artwork and correcting its loading priority.
5. Local fonts: smaller files and immediate text
Moving Inter from Google Fonts to local hosting removed a third-party dependency, but the first local files were still too large. Four weights totalled approximately 445 KiB. Therefore, we created Serbian Latin WOFF2 subsets containing č, ć, š, ž and đ, together with required punctuation, currency signs and interface symbols.
| Weight | Optimized file | New size |
| 400 Regular | Inter-Regular-sr-latin.woff2 | 40,412 B |
| 500 Medium | Inter-Medium-sr-latin.woff2 | 41,572 B |
| 600 SemiBold | Inter-SemiBold-sr-latin.woff2 | 41,656 B |
| 700 Bold | Inter-Bold-sr-latin.woff2 | 41,732 B |
The combined size dropped to approximately 161 KiB, a reduction of about 64%. We then configured a separate local font family with font-display: swap. An A/B test showed a hero text render delay of about 340 ms with a system font and about 330 ms after Inter was correctly configured. This confirmed that the brand font could remain without blocking initial text.
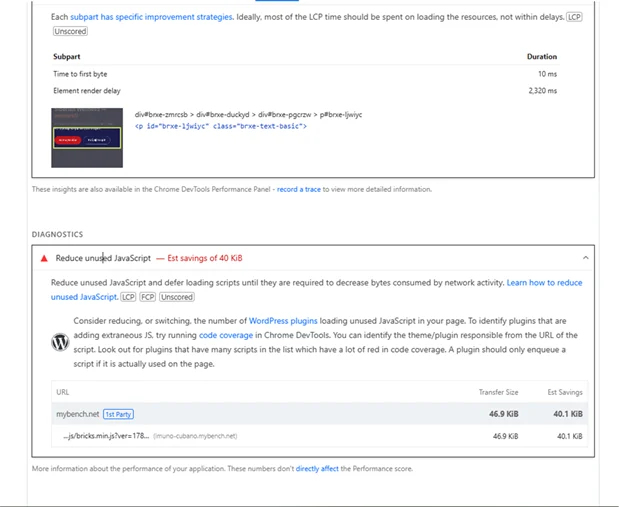
Figure 6. Optimized local Inter subsets in the critical dependency chain.
6. The hidden bottleneck: global JavaScript delay
At one stage, the mobile hero paragraph showed an element render delay of approximately 2,320 ms. When the global JavaScript delay setting was disabled, the same element remained the LCP candidate, but its render delay fell to about 260 ms. The improvement was approximately 2,060 ms, or 89%.
In other words, the optimization tool had not merely postponed nonessential scripts; it had delayed the logic responsible for revealing the hero content. A render-blocking jQuery request then became visible, but Lighthouse estimated only about 150 ms of possible savings. With TBT still at 0 ms, aggressively delaying jQuery again would have treated the smaller warning while recreating the larger problem.
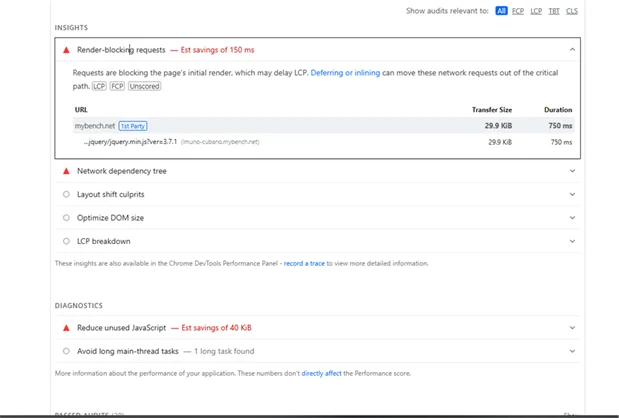
Figure 7. With global JavaScript delay disabled, the hero element render delay fell to approximately 260 ms.
| Lesson defer and “delay until interaction” are not equivalent. Scripts that control above-the-fold visibility must not wait for user interaction. |
7. Stabilizing the mobile hero slider
First, we made the active slide visible directly through the initial HTML and critical mobile CSS. We also removed opacity, visibility, transforms, transitions and animations from the active slide during the initial mobile render. JavaScript could still control navigation afterwards, but the first meaningful paint no longer required it.
Testing also showed that an automatic slide change could create a later LCP candidate. Autoplay therefore had to be treated carefully: the initial slide must remain stable long enough for the browser to complete the first rendering milestone.
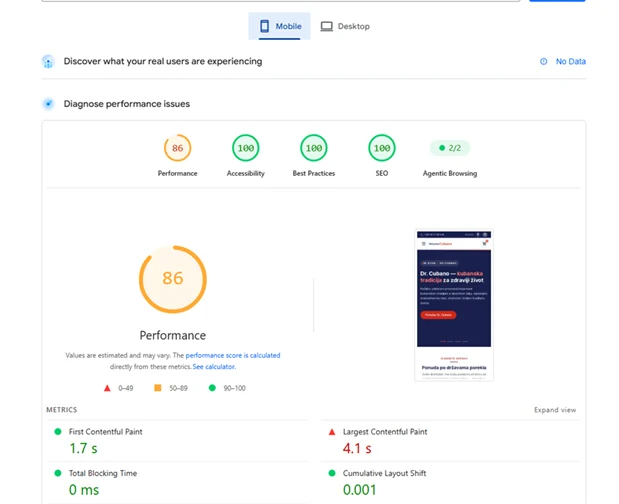
Figure 8. With critical hero CSS and font-display: swap, the hero render delay stayed near 330 ms.
8. Bricks External Files produced the largest single gain
Changing the Bricks CSS Loading Method to External Files produced the best individual mobile run: Performance 95, FCP 1.8 s, LCP 2.6 s, TBT 0 ms and CLS 0.001. The result was significant because Lighthouse still reported some render-blocking resources. The measured user-facing metrics improved even though the warning list did not become completely empty.
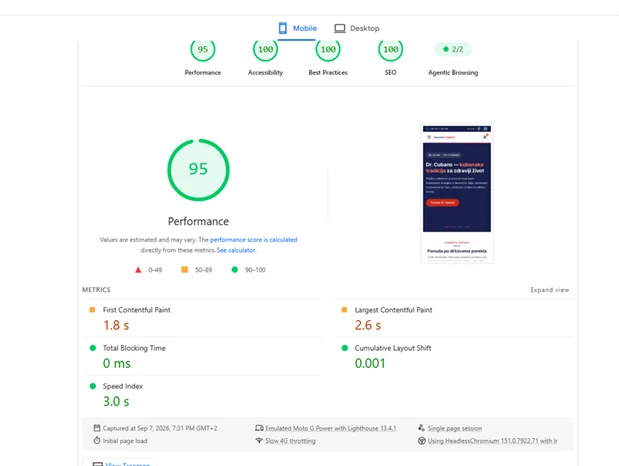
Figure 9. Intermediate mobile run: Performance 95 and LCP 2.6 s.
9. Optimizations that did not help
- Preloading post-250.min.css did not solve the late LCP. The file was only about 2.3 KiB and loaded in approximately 113–150 ms.
- Aggressively delaying every stylesheet caused late style application and less stable results.
- Preloading four manual font files while automatic font preloading was enabled also fetched unnecessary Thin and ExtraLight files.
- Global JavaScript delay reduced early requests but delayed the hero content itself.
- Forced reflow remained between roughly 60 and 99 ms, but it was marked Unscored and was not responsible for the large score loss.
One technical defect was especially important: delayed stylesheet tags received repeated media=”print”, onload and cache-plugin attributes. A transformation like this must be idempotent. In other words, the tool should process each resource once and clear the load handler before switching the media value.
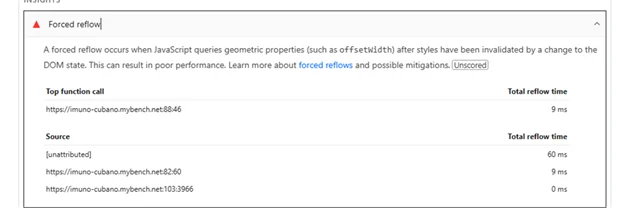
Figure 10. Forced reflow was measurable but unscored and comparatively small.
10. Final stable configuration
- Bricks CSS Loading Method: External Files.
- Local Serbian Latin Inter subsets with font-display: swap.
- Safe JavaScript defer, without a global delay-until-interaction rule.
- The active mobile hero slide is visible in the initial HTML/CSS state.
- Explicit image dimensions; no lazy loading for the LCP hero asset.
- Long-lived browser caching and immutable headers for versioned static assets.
- No preload for small page CSS files or fonts that are not required above the fold.
11. Final results
Mobile PageSpeed report: https://pagespeed.web.dev/analysis/https-imuno-cubano-mybench-net/xiamn7be4k?form_factor=mobile
Desktop PageSpeed report: https://pagespeed.web.dev/analysis/https-imuno-cubano-mybench-net/q0aua9h9pb?form_factor=desktop
The final follow-up measurement reached 100 on desktop and 98 on mobile. In addition, Accessibility, Best Practices and SEO reached 100 on both profiles. The mobile result recorded FCP at 1.4 seconds, LCP at 2.3 seconds, TBT at 0 ms, CLS at 0 and Speed Index at 1.4 seconds. These results preserved the stable above-the-fold rendering established during the earlier optimization passes.
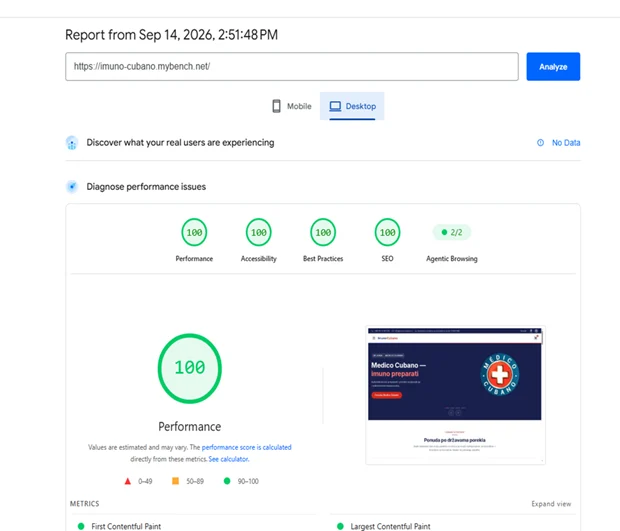
Figure 11. Final desktop result: Performance 100, with Accessibility, Best Practices and SEO also at 100.
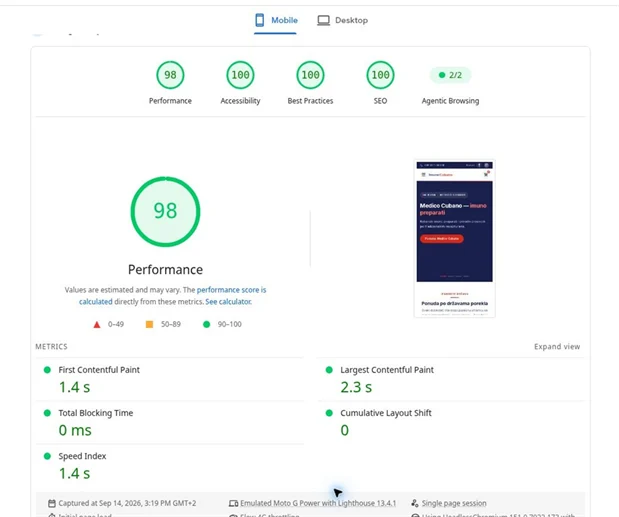
Figure 12. Final mobile result: Performance 98, FCP 1.4 s, LCP 2.3 s, TBT 0 ms, CLS 0 and Speed Index 1.4 s.
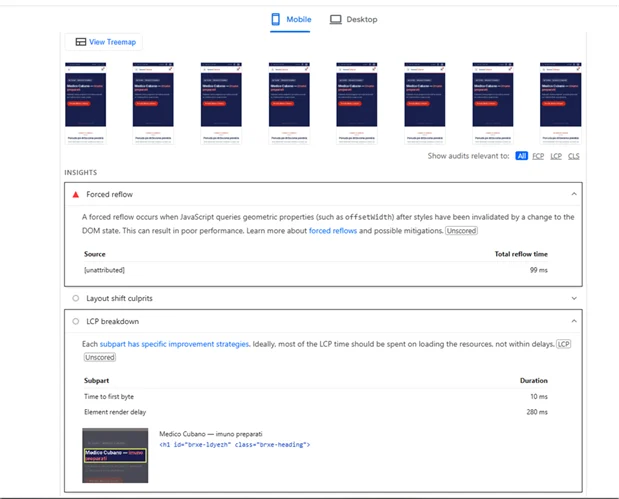
Figure 13. Final LCP breakdown: the hero H1 rendered with a 10 ms TTFB and approximately 280 ms element render delay.
12. Caching layer: DJIA Cache configuration
The front-end work in Sections 1–9 removed render-blocking weight from every request. The remaining piece was making sure repeat and anonymous requests did not have to rebuild that work on every page load. DJIA Cache (https://djia-cache.com/), a full-page HTML cache plugin by Techoli Company, handles that with a configuration specific to this stack. The site runs on the Techoli Company Theme, a child theme built on the Bricks visual builder, together with WooCommerce. The settings below reflect the production configuration in place after the optimization passes described above.
12.1 Page cache and purge rules
- Page Cache is enabled for anonymous visitors, with a Cache TTL of 41 days and hourly WP-Cron cleanup.
- WooCommerce purge & regenerate is enabled for product saves: the product URL plus Shop and category/tag listings are purged and re-cached in the background without slowing down the save or wiping the entire cache.
- Rebuild TTL is set to 1 hour, used as the target refresh interval for rebuild/warm actions.
- The logged-in/role cache bucket auto-deletes after 3600 seconds; purge-on-login and purge-on-logout are left off, since this storefront does not need an immediate per-session purge.
- Checkout-related paths (/cart/, /checkout/, /my-account/, /korpa/, /blagajna/) and dynamic query keys (add-to-cart, wc-ajax, preview, bricks, customize_changeset_uuid) bypass the cache, together with the wordpress_logged_in and comment_author_ cookies.
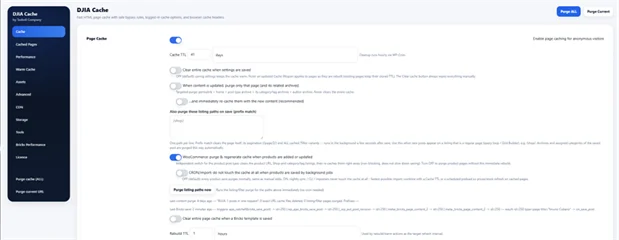
Figure 14. Page cache and WooCommerce purge/regenerate settings.
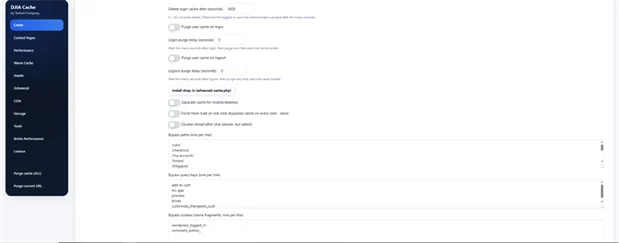
Figure 15. Login/logout purge delays and cache bypass rules.
12.2 Server-level fast path and object cache
- Fast Path (server-level, no PHP) is enabled: eligible anonymous, default-language GET requests with no query string are served directly from an on-disk cache file through an .htaccess rule, skipping PHP and WordPress entirely. Every other request still goes through the normal page cache.
- Cache storage format is set to Both (.html + .html.gz) at gzip level 9, so compressed files are served without runtime compression.
- File-based persistent Object Cache is enabled as a drop-in.
- Filter Fast Path is left off; it targets a separate AJAX filter plugin not used at full capacity on this site.
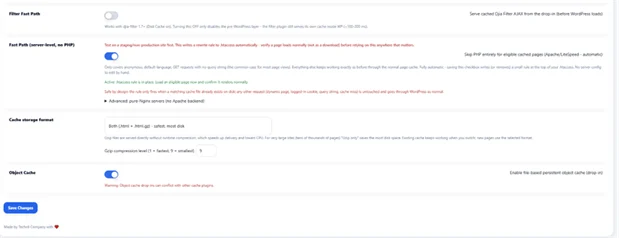
Figure 16. Server-level Fast Path rule and file-based Object Cache.
12.3 Static assets and JavaScript
- Static Asset Caching is enabled with a Static asset TTL of 31,536,000 seconds (one year), written as an Apache Cache-Control snippet covering css, js, png, jpg, jpeg, gif, svg, webp, woff2, woff, ttf and eot.
- JavaScript Optimization (defer on enqueued scripts) is enabled, with bricks.min.js and jquery.min.js excluded from deferral so the above-the-fold behavior described in Section 6 is not affected.
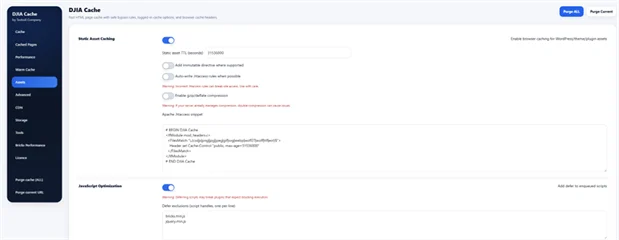
Figure 17. Static asset caching (1-year TTL) and JavaScript defer with exclusions.
12.4 Resource hints
- Preconnect is configured for https://fonts.gstatic.com.
- The three Serbian Latin Inter subsets from Section 5 (Bold, Regular and SemiBold) are listed as preloaded font URLs.
- The hero-image and page-CSS preload fields are left empty. Section 9 found that manual preloading duplicated automatic preloads and fetched unnecessary font weights, so only the fonts actually needed above the fold are preloaded here.
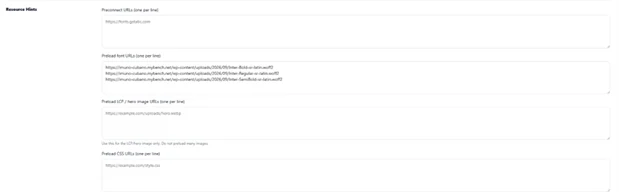
Figure 18. Preconnect and preloaded local Inter font subsets.
12.5 CSS delivery and minification
- Delay CSS loading is enabled for non-excluded stylesheets, while post-250.min.css — the page’s own stylesheet — stays in the delay-exclusion list, consistent with Section 9’s finding that touching this file did not solve the late LCP.
- Used CSS scope is restricted to static pages only, with a safelist for Bricks and slider classes (brxe-*, brx-*, swiper*, splide*, is-active) so dynamic UI states keep their styling.
- Auto-generate Used CSS and automatic per-post delay are both left off, matching Section 9’s finding that aggressively delaying every stylesheet produced late style application and less stable results.
- CleanTalk anti-spam assets are unloaded on pages without forms or contact areas.
- Minify HTML and Minify CSS files are enabled; Minify JS files is left off; font-display: swap for Google Fonts is left off since fonts are served locally, as described in Section 5.
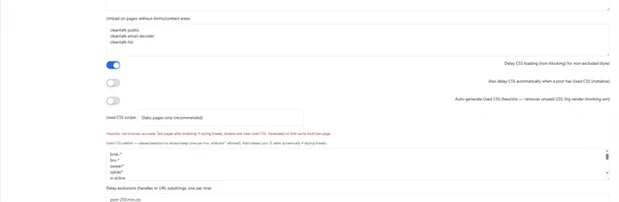
Figure 19. Delayed CSS loading and Used CSS scope with a Bricks/slider safelist.
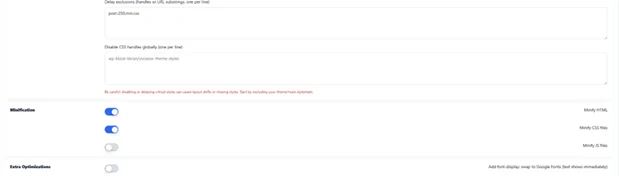
Figure 20. Minification: HTML and CSS minified, JS left unminified.
Combined with the front-end changes in Sections 1–9, this caching layer is why the final Lighthouse runs in Section 11 held steady across repeated tests rather than swinging between a cache-cold and a cache-warm load.
Conclusion
The largest improvement did not come from an “optimize everything” switch. Instead, it came from a sequence of controlled changes: removing unnecessary icon and font dependencies, resizing and prioritizing the hero image, reducing local font payload by about 64%, applying font-display: swap, removing JavaScript from the initial visibility path, stabilizing the mobile slider and switching Bricks CSS delivery to External Files.
Desktop Performance increased from 61 to 100 and mobile Performance from 49 to 98. Mobile LCP fell from 12.5 to 2.3 seconds, while CLS fell from 0.976 to 0. In addition, Accessibility, Best Practices and SEO all reached 100.
The broader lesson is that Lighthouse works best as a diagnostic instrument, not as a checklist of switches. Therefore, reliable optimization requires isolated tests, attention to directly scored metrics, and a refusal to trade stable rendering and functionality for a cleaner warning list.